The platform

This is what the platform looks like. Six of its screens, and what each one is for.

These are drawn from a demonstration portfolio of fourteen care homes and 888 beds. Six of thirty eight modules, chosen because they are the ones people ask to see. They are shown small on purpose. Hover a marker to see what sits there.

One

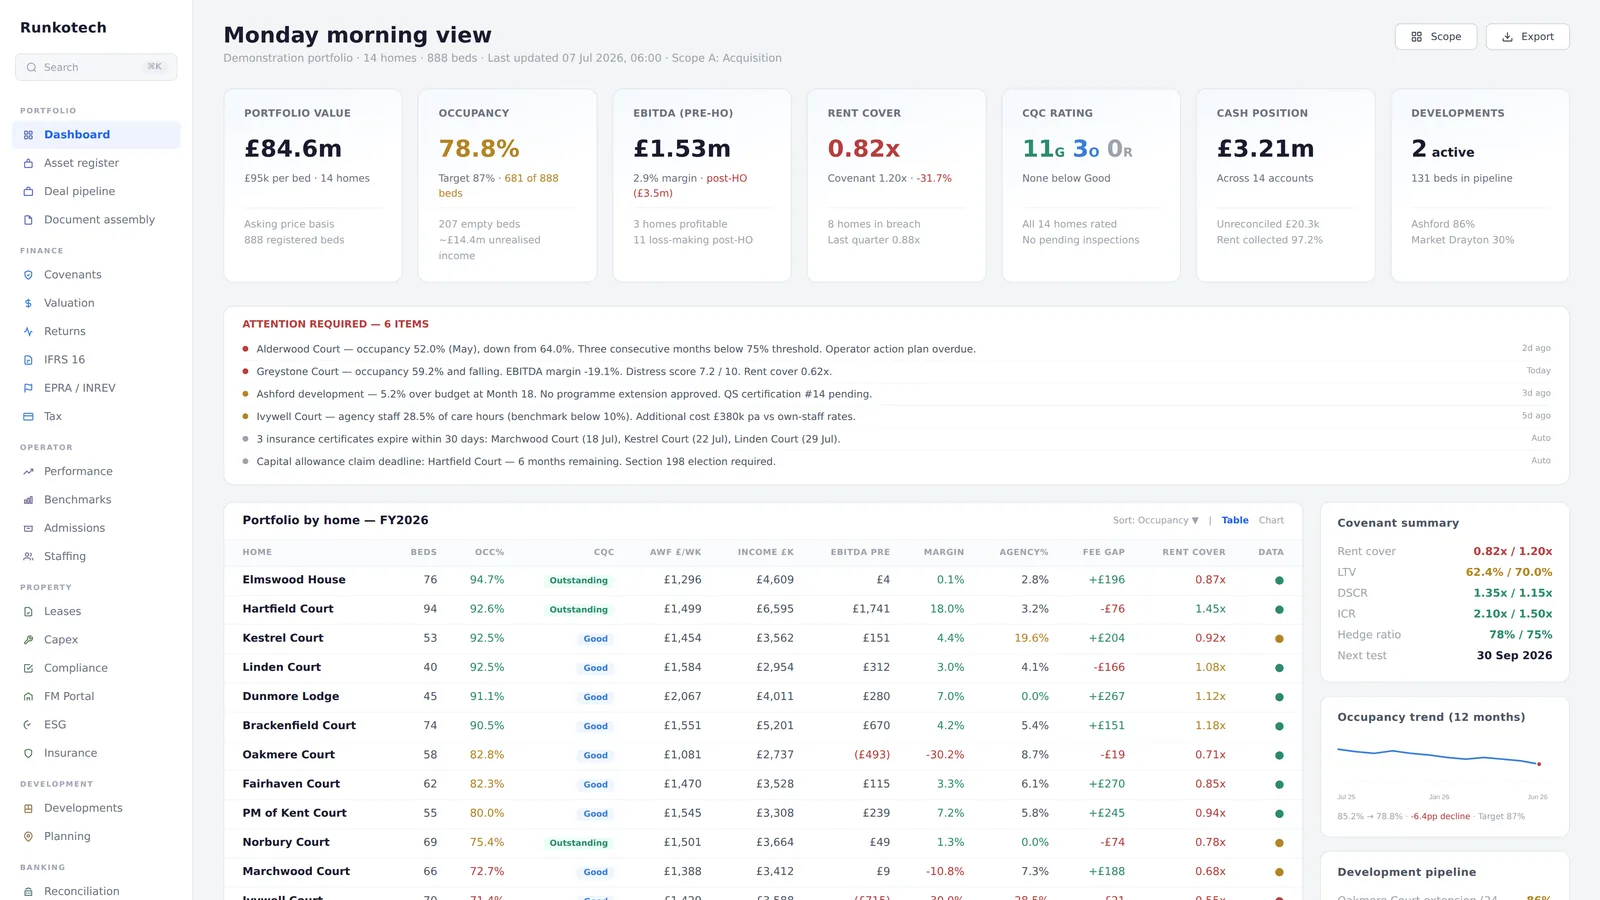
The Monday morning view.

Portfolio value, occupancy against target with the empty beds priced, EBITDA before and after head office, rent cover against the covenant, inspection ratings, cash across every account, and the developments in flight. Then an action required section, set apart on its own, carrying the six issues the platform raised this morning without being asked, oldest first. Underneath it, every care home in one sortable table.

Portfolio · Monday morning viewIllustrative
The Monday morning view across fourteen homes.
Assembled before anyone arrives. Every row opens to the care home.

Two

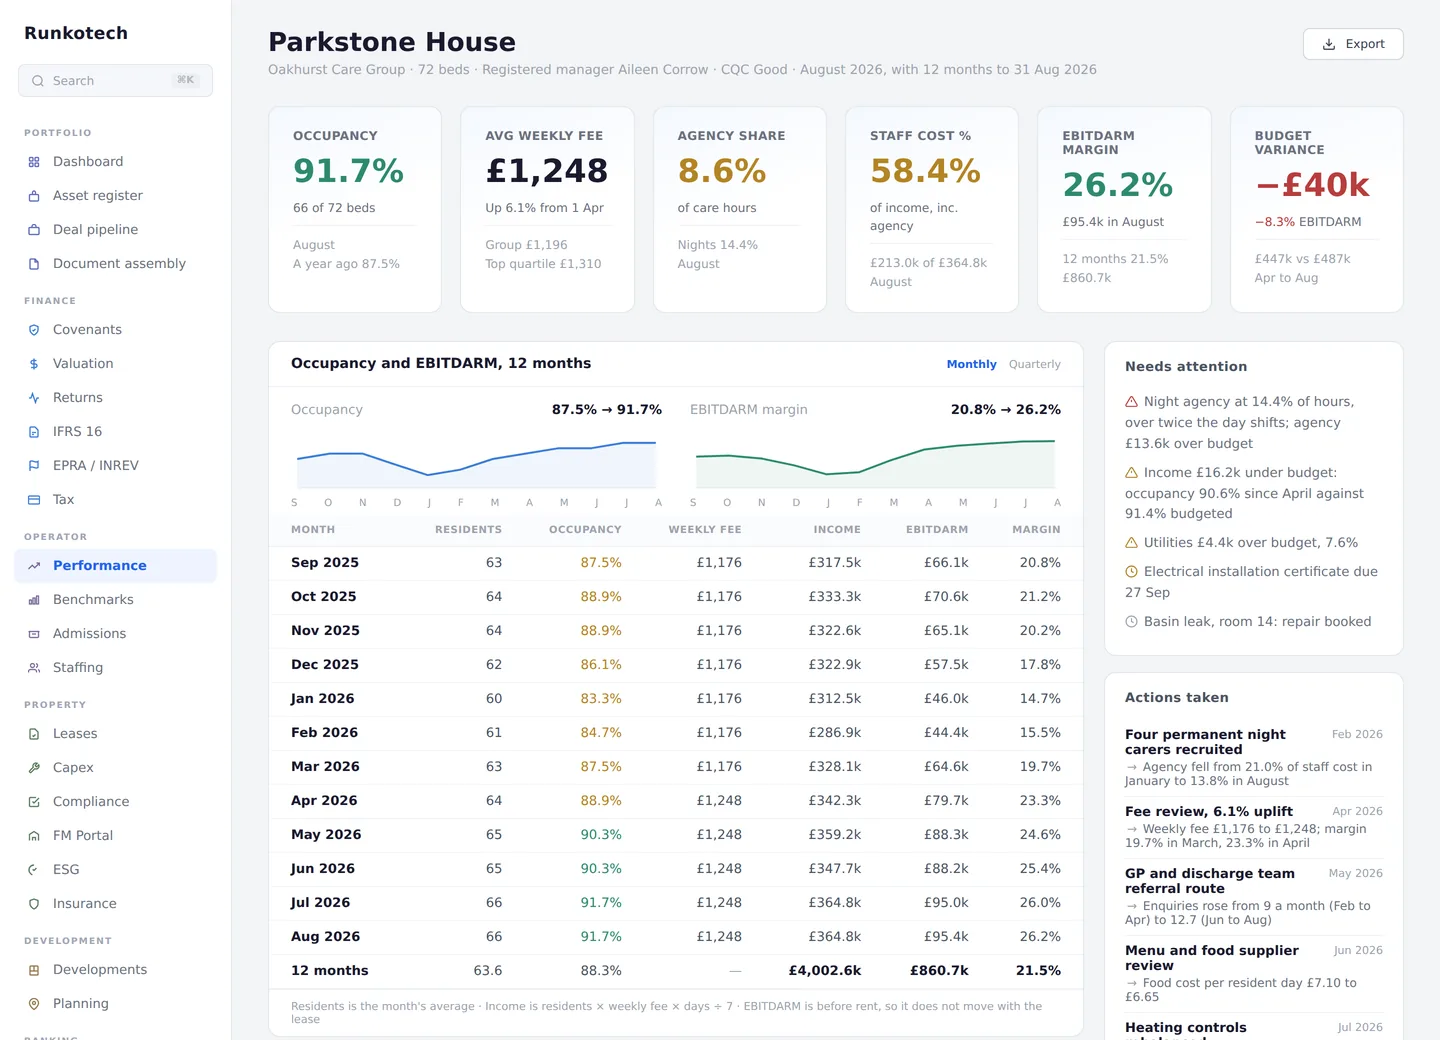
Operator performance.

One care home, twelve months. Occupancy, average weekly fee, agency share of care hours, staff cost as a share of income, EBITDARM margin and budget variance. Underneath, the month by month table, and beside it the actions already taken with the effect each one had.

Operator · PerformanceIllustrative
Twelve months of trading for a single home.
Cause separated from symptom. A margin move resolves into fee, occupancy, agency or cost.

Three

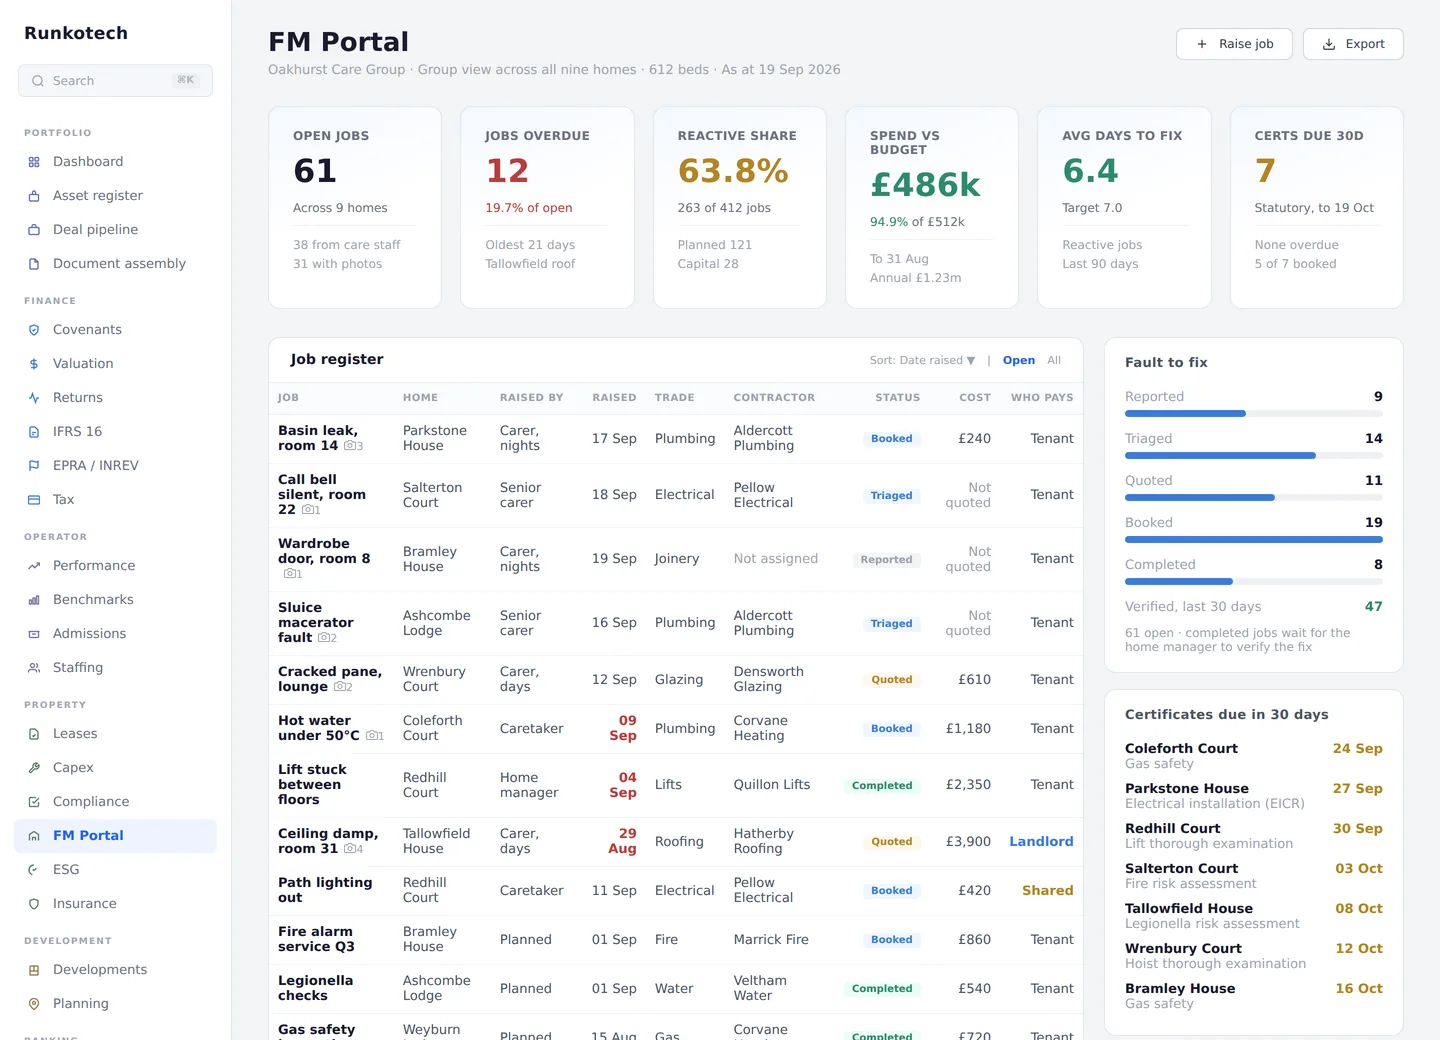
The FM portal.

Open and overdue jobs across every site, reactive against planned, spend against budget, average days to fix, and statutory certificates falling due inside thirty days. The register below carries who raised each job, the trade, the contractor and who pays, with photographs where there are any. Care staff can report a fault by emailing a photograph to the platform, and it is filed against the building, the location and the kind of issue without anybody typing it in.

Property · FM portalIllustrative
The FM portal and its job register.
Joined to the capital plan. And to the rooms the work takes out of use.

Four

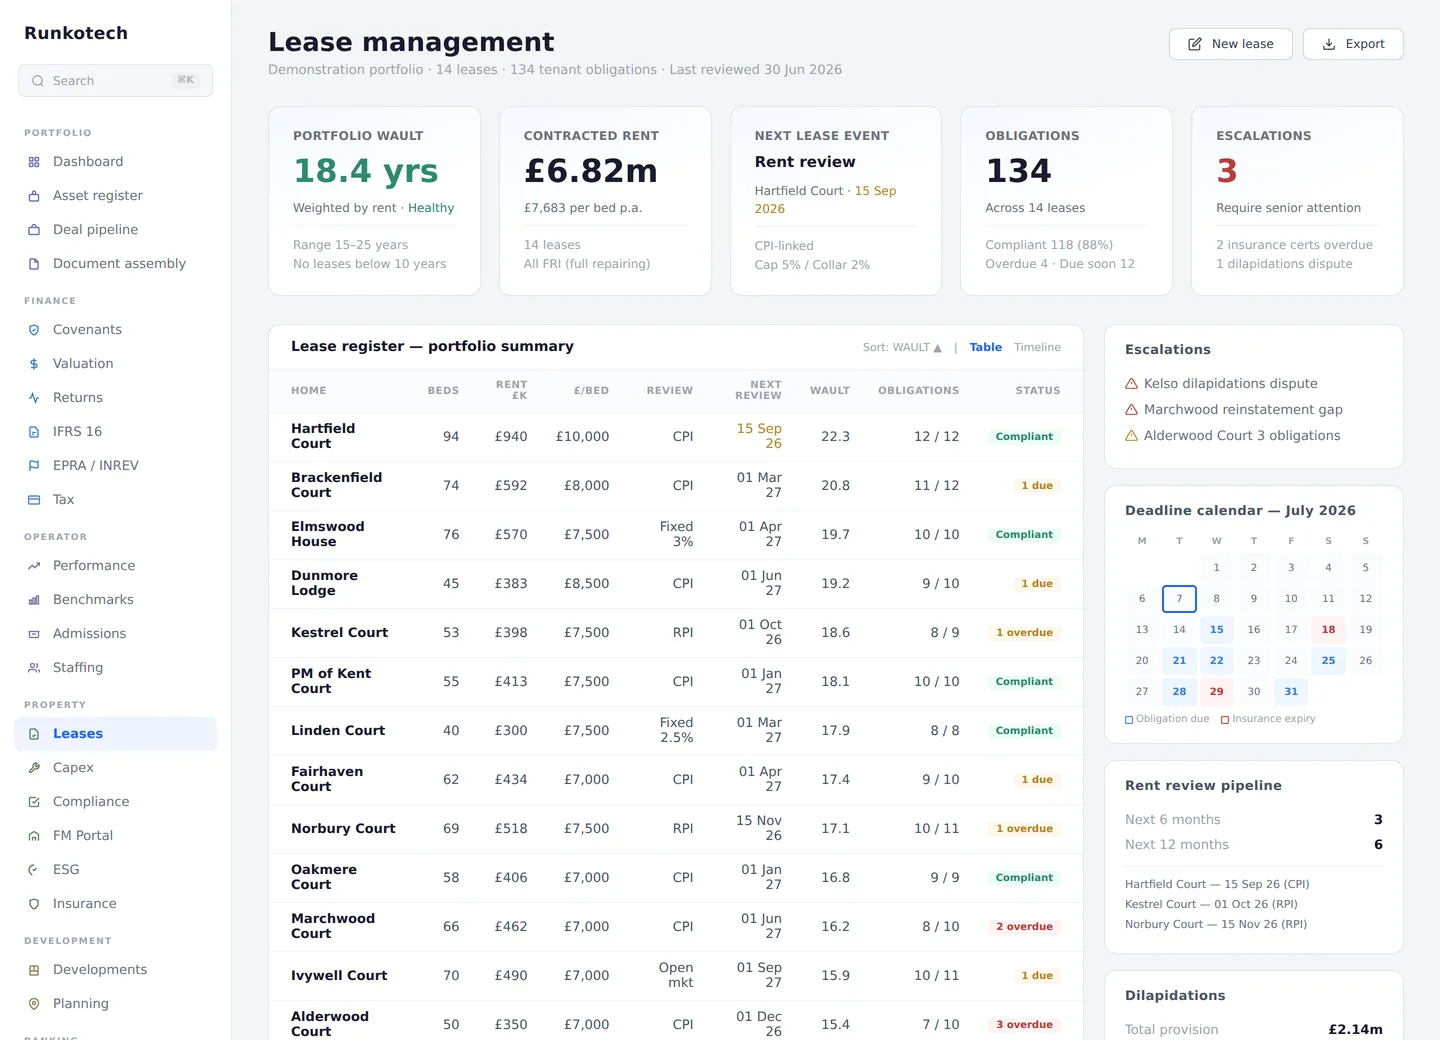
Lease management.

The register, with rent per bed, review basis and the next review date read from the document rather than typed in. Weighted term held separately from contractual term, because they answer different questions. Tenant obligations counted as met, due and overdue, and the dilapidations provision taken from the latest assessment rather than a rule of thumb.

Property · LeasesIllustrative
The lease register with obligations and review pipeline.
Every mechanic from the file. Escalations raised rather than discovered at review.

Five

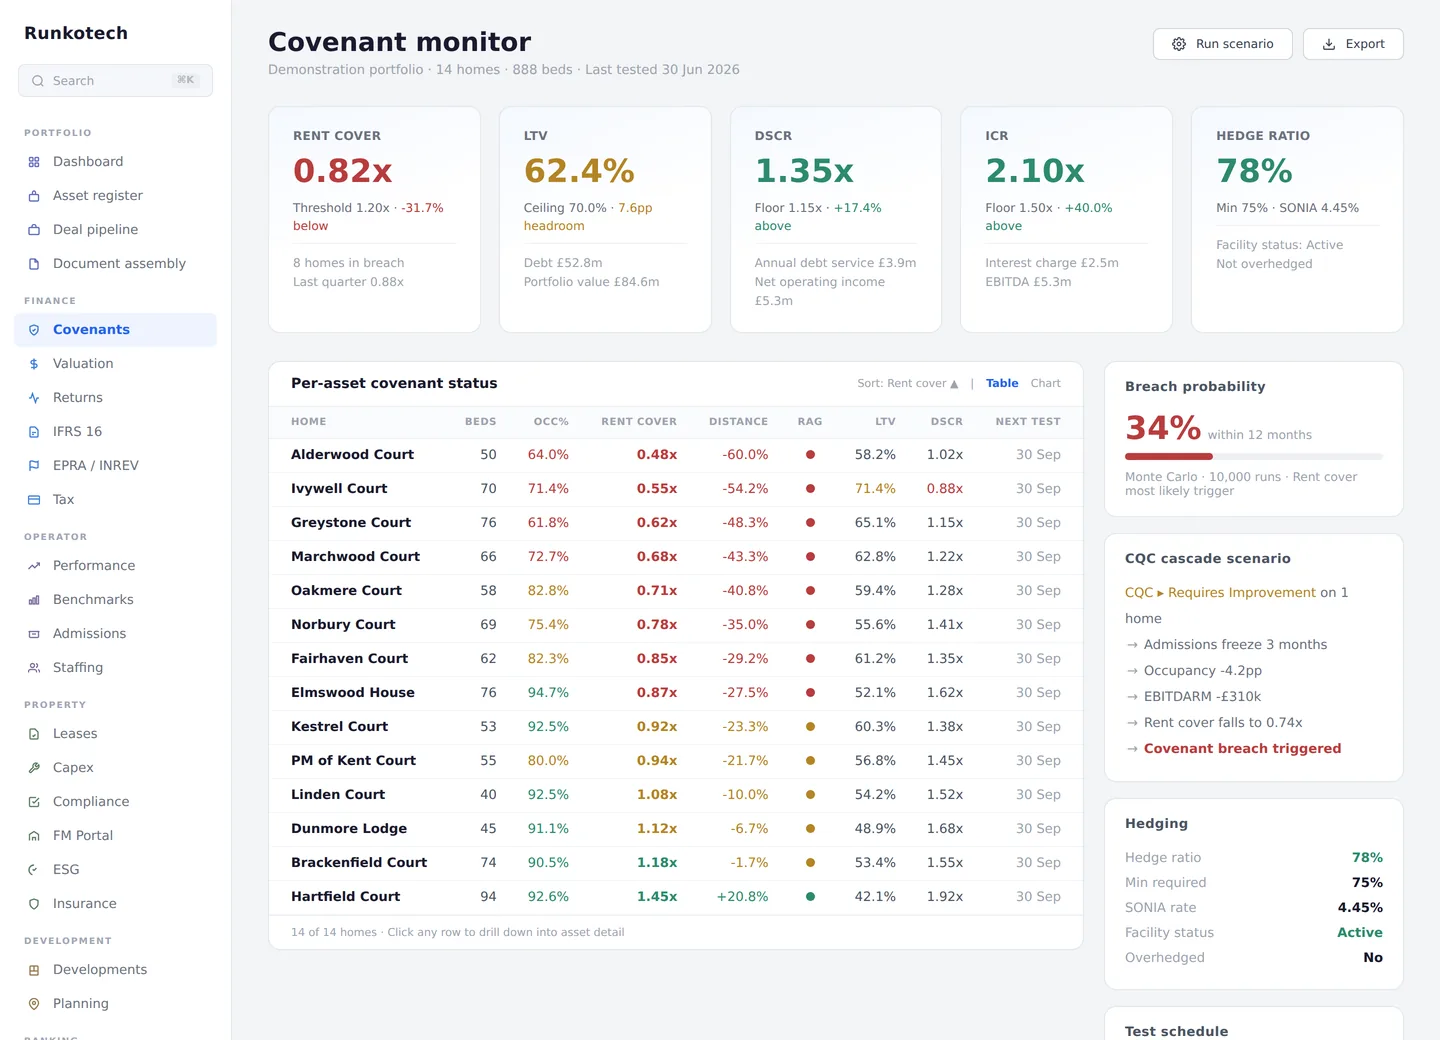
The covenant monitor.

Rent cover, loan to value, debt service cover, interest cover and hedging, each against the threshold in the loan agreement with your lender. Every care home listed by distance to a formal breach rather than by a traffic light, with a breach probability and the scenario that drives it.

Finance · CovenantsIllustrative
The covenant monitor with per asset status.
Platform derived, and labelled as such, so you always know whether a figure was read from a document or calculated here.

Six

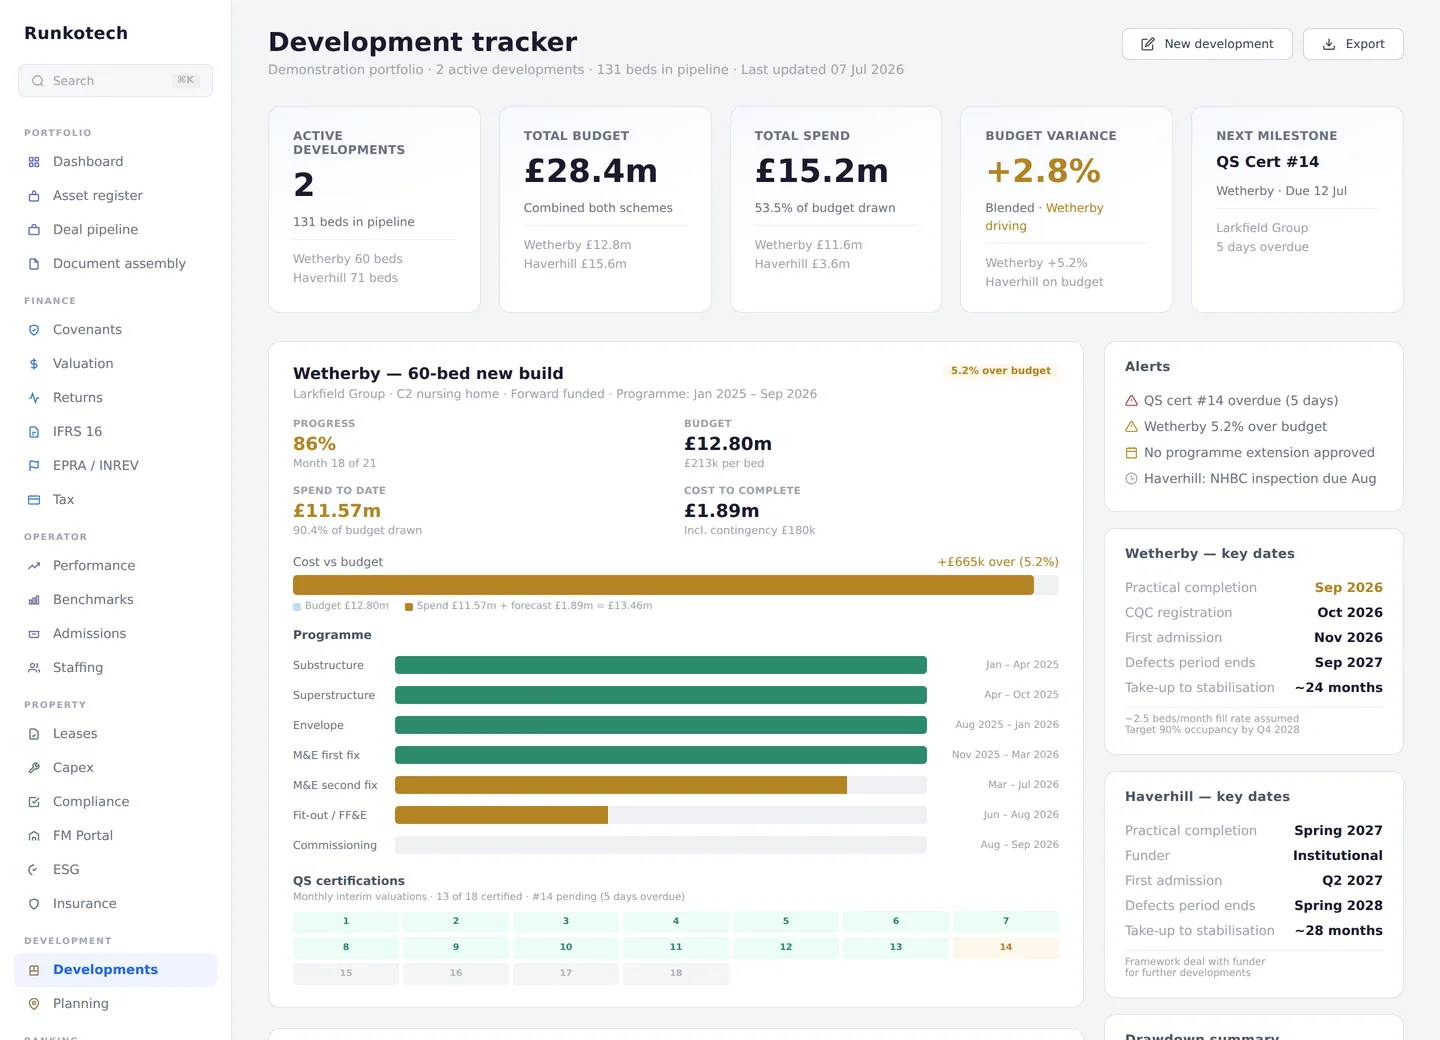
The development tracker.

Appraisal as the baseline, then programme by trade package, cost to complete, variations against contingency, retention and the interim valuation certificates with the overdue one named. Key dates run through to stabilisation, carrying the fill rate the appraisal assumed, so lease up is measured against the underwriting rather than against hope.

Development · TrackerIllustrative
The development tracker with budget, programme and certifications.
One chain, appraisal to practical completion. At completion the certificates, warranties and defects period open the compliance register for that building.

Underneath every module, the same rule applies to every figure.

Under every page sits the figure, the fields it was derived from, and the page of the document it was read from, which is what an audit asks for. Click any figure and follow it back. For anyone who has to sign a report, that is the question after "is this my data", and it is the one most systems cannot answer.

Start with one

Thirty-eight modules. Switch on one.

Fifteen run on their own. The five filled in have a page of their own; the rest are on the modules page.

Nothing has to be migrated when you add the second, because they all sit on one record.

Each one reads from the systems you already run, an admissions system, a defects tracker during a development, a construction cost package, a payroll or clinical system, and brings what they hold into the same record.

White label

A group with several portfolios, a management company reporting to more than one owner, or an adviser putting it in front of clients can run any of it under their own name and logo.

Worked examples

Worked example one

The agency bill nobody had priced

Ivywell Court runs 28.5% of its care hours through agency against a sector benchmark below 10%. On the monthly management accounts it appears as a single staffing line that is a little over budget. Six months of it is £118,600 and the year runs at £380,400 against own-staff rates, and it is why the home loses £715,000.

  • What the operator saw: staffing 6% over budget, three months running.
  • What was underneath: 28.5% agency, concentrated on nights, at 1.9 times own-staff cost.
  • What it reached: EBITDARM, then the valuation at 7.2×, then rent cover at 0.55× against a 1.20× covenant.
  • What the platform showed: the hours, the rate and the home were already held, so the invoice was the only missing piece. The whole picture was visible the moment it arrived rather than at the quarter.

Download the one-page example (PDF)

Operator · Staffing · Ivywell CourtIllustrative
Agency share of care hours28.5%benchmark below 10%
Cost above own staff£380ka year
Rent cover0.55×covenant 1.20×
EBITDARM−£715ka year, 30.0% margin
Agency share by monthagainst the 10% benchmark
Jan9.7%
Feb11.6%
Mar14.9%
Apr18.8%
May23.1%
Jun28.5%

Six months of drift, each month inside the tolerance on the staffing line, and nobody looked at the series.

Worked example two

Three beds, then five, and two covenants gone

Hartfield Court is the best home in the portfolio: 94 beds, 92.6% full, rated Outstanding, rent covered 1.45 times. It is also three empty beds from breaching loan-to-value and five from breaching rent cover, because a home is valued on what it earns and the debt against it does not move.

  • Each empty bed: £77,948 of fee a year, less £4,472 of food and consumables.
  • Out of EBITDARM: £73,476, because staffing, rent, insurance and compliance do not stop.
  • Off the value: £506,578, on a desktop valuation that re-runs the 7.2× multiple and the 4% notional management charge the last RICS valuation struck. A valuer confirms it at the next instruction; the platform shows it the month it happens.
  • At three beds: loan-to-value 73.5% against a 70.0% ceiling. At five, rent cover 1.14× against 1.20×.

Download the one-page example (PDF) Or move the slider yourself

Finance · Covenants · Hartfield CourtIllustrative
Headroom, bed by bedloan-to-value against the 70.0% ceiling
0 beds empty62.3%
1 bed65.8%
2 beds69.7%
3 beds73.5%
4 beds79.1%
5 beds84.9%

The dark line is the covenant ceiling. Two empty beds leaves three tenths of a point of headroom; the third bed goes through it.

Go deeper

A walkthrough, on whichever modules matter to you.

Someone takes you through the modules you actually care about, on the demonstration portfolio, and you ask whatever you like while the screen is in front of you. Usually half an hour, and we come with questions, because we have worked on the operator’s side of these structures.

  • Whichever of the thirty-eight modules are of interest to you
  • How a change moves through the record, shown live
  • What we ask of you to get started, and what it costs
  • Security, hosting and the certification timetable